
- You are here:
- Home

- Program
Program
Location: Convention Hall 1, Section D
9:00-9:10, Opening Address
Torsten Möller, Shixia Liu

Pat Hanrahan
Keynote: Automating Analysis?
Pat Hanrahan, Stanford University
Abstract: There have been great advances in machine learning lately, in particular, deep learning. The result has been even more intelligent systems, such as image recognition, AlphaGo and self-driving cars. The technologies of machine learning are similar in many ways to those used in statistical data analysis. So, a natural question is - can AI be applied to analysis? That is, can people doing analysis be replaced by automated systems? In this talk, I will explore this question.
Bio: Pat Hanrahan is a computer graphics researcher, the Canon Professor of Computer Science and Electrical Engineering in the Computer Graphics Laboratory at Stanford University. He is also Tableau’s Chief Scientist.
His current research involves rendering algorithms, high performance graphics architectures, and systems support for graphical interaction. He also has worked on raster graphics systems, computer animation and modeling and scientific visualization, in particular, volume rendering. Before joining Stanford he was a faculty member at Princeton.
Pat has also worked at Pixar where he developed volume rendering software and was the chief architect of the RenderMan Interface - a protocol that allows modeling programs to describe scenes to high quality rendering programs. Pat has received three Academy Awards for Science and Technology, the Spirit of America Creativity Award, the SIGGRAPH Computer Graphics Achievement Award, the SIGGRAPH Stephen A. Coons Award, and the IEEE Visualization Career Award.
Session 1: Interactive ML
10:10-10:40, Session Chair: Eli Brown, Depaul
10:10-10:25
Paper: BEAMES: Interactive Multi-Model Steering, Selection, and Inspection for Regression Tasks
Subhajit Das, Dylan Cashman, Remco Chang, Alex Endert
Abstract: Interactive model steering helps people incrementally build machine learning models that are tailored to their domain and task. Existing visual analytic tools allow people to steer a single model (e.g., assignment attribute weights used by a dimension reduction model). However, the choice of model is critical in such situations. What if the model chosen is sub-optimal for the task, dataset, or question being asked? What if instead of parameterizing and steering this model, a different model provides a better fit? This paper presents a technique to allow users to inspect and steer multiple machine learning models. The technique steers and samples models from a broader set of learning algorithms and model types. We incorporate this technique into a visual analytic prototype, BEAMES, that allows users to perform regression tasks via multi-model steering. This paper demonstrates the effectiveness of BEAMES via a use case and discusses broader implications for multi-model steering.
10:25-10:40
Paper: Homology-Preserving Dimensionality Reduction via Manifold Landmarking and Tearing
Lin Yan, Yaodong Zhao, Paul Rosen, Carlos Scheidegger, Bei Wang
Abstract: Dimensionality reduction is an integral part of data visualization. It is a process that obtains a structure preserving low-dimensional representation of the high-dimensional data. Two common criteria can be used to achieve a dimensionality reduction: distance preservation and topology preservation. Inspired by recent work in topological data analysis, we are on the quest for a dimensionality reduction technique that achieves the criterion of homology preservation, a specific version of topology preservation. Specifically, we are interested in using topology-inspired manifold landmarking and manifold tearing to aid such a process and evaluate their effectiveness.
10:40-11:00, Coffee Break

Kirk Goldsberry
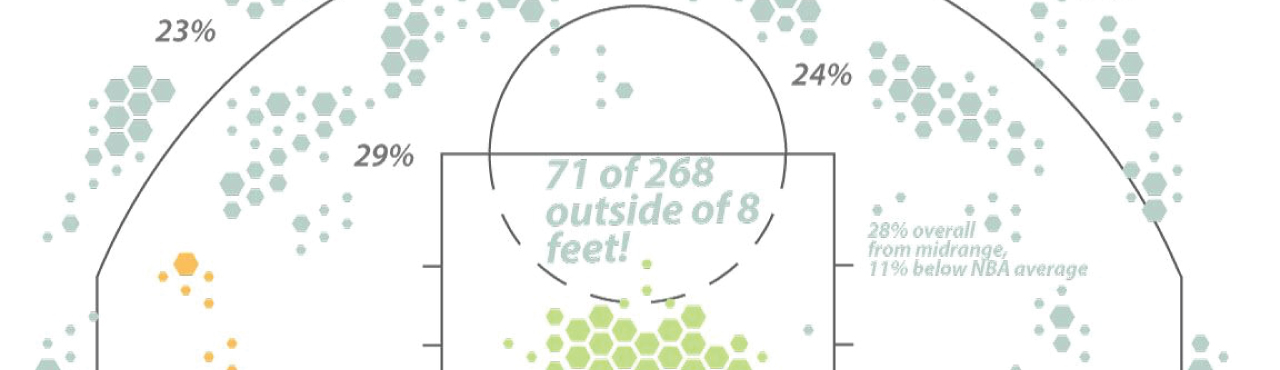
Keynote: Analytics Illustrated - How Visualization Is Changing Sports Forever
Kirk Goldsberry, San Antonio Spurs
Abstract: Since Michael Lewis published “Moneyball” in 2003, sports discourse has become increasingly more analytical and data driven. However, only recently is it becoming properly visual. The intersection of visualization and sports analytics is a truly exciting place in 2018, and this presentation describes how and why visualization is uniquely equipped to reform and reshape sports discourse forever.
The presentation includes two sections. First, we investigate how visualization has helped shaped new analytical awakenings in professional basketball this decade and how those awakenings are reshaping the entire aesthetic of the sport. Recent visual advances in basketball analytics have enabled the construction and dissemination of new knowledge centered around the key interactions between performance and space in the NBA. In turn, organizations are responding by altering in-game strategies, player valuations, and player development protocols.
Second, we examine the relatively slow adoption of visual analytics in the sports world. Despite the massive appetite for insights about athletes and teams, pro sports have generally been slow to leverage the immense opportunities visual analytics provide. Why is this? One reason is the simple lack of available data; however, that’s not all. In many cases, available data exists for years before powerful visual treatments are leveraged. This lag is both fascinating and important to investigate in part because it is by no means unique to the sports industry. We conclude with the identification of key concepts that will guide the future interactions between sports and visual data science.
Bio: Kirk Goldsberry is one of the leading experts in basketball analytics, a booming new field that has taken the sport by storm. He is currently the Vice President of Strategic Research for the San Antonio Spurs and the chief analytics consultant for USA Basketball. Previously a staff writer at Grantland and FiveThirtyEight.com(http://FiveThirtyEight.com), he has written hundreds of articles about the NBA. Prior to his writing career, Goldsberry worked as a professor at Harvard University and Michigan State University.
Session 2: Deep Learning
12:00-12:45, Session Chair: Hendrik Strobelt, IBM Research AI
12:00-12:15
Paper: DeepCompare: Visual and Interactive Comparison of Deep Learning Model Performance
Sugeerth Murugesan, Sana Malik, Fan Du, Eunyee Koh, Tuan Manh Lai
Abstract: Deep learning models have become the state-of-art for many tasks, from text sentiment analysis to facial image recognition. However, understanding why certain models perform better than others or how one model learns differently than another is often difficult yet critical for increasing their effectiveness, improving prediction accuracy, and enabling fairness. Traditional methods for comparing models’ efficacy, such as accuracy, precision, and recall provide a quantita- tive view of performance, however, the qualitative intricacies of why one model performs better than another are hidden. In this work, we interview machine learning practitioners to understand their evalua- tion and comparison workflow. From there, we iteratively design a visual analytic approach, DeepCompare, to systematically compare the results of deep learning models, in order to provide insight into the model behavior and interactively assess trade-offs between two such models. The tool allows users to evaluate model results, iden- tify and compare activation patterns for misclassifications and link the test results back to specific neurons. We conduct a preliminary evaluation through two real-world case studies to show that experts can make more informed decisions about the effectiveness of dif- ferent types of models, understand in more detail the strengths and weaknesses of the models, and holistically evaluate the behavior of the models.
12:15-12:30
Paper: Visualization-Assisted Development of Deep Learning Models in Offline Handwriting Recognition
Martin Schall, Dominik Sacha, Manuel Stein, Matthias Franz, Daniel Keim
Abstract: Deep learning is a field of machine learning that has been the focus of active research and successful applications in recent years. Offline handwriting recognition is one of the research fields and applications were deep neural networks have shown high accuracy. Deep learning models and their training pipeline show a large amount of hyper-parameters in their data selection, transformation, network topology and training process that are sometimes interdependent. This increases the overall difficulty and time necessary for building and training a model for a specific data set and task at hand. This work proposes a novel visualization-assisted workflow that guides the model developer through the hyper-parameter search in order to identify relevant parameters and modify them in a meaningful way. This decreases the overall time necessary for building and training a model. The contributions of this work are a workflow for hyper-parameter search in offline handwriting recognition and a heat map based visualization technique for deep neural networks in multi-line offline handwriting recognition. This work applies to offline handwriting recognition, but the general workflow can possibly be adapted to other tasks as well.
12:30-12:45
Paper: Data2Vis: Automatic Generation of Data Visualizations Using Sequence to Sequence Recurrent Neural Networks
Victor C Dibia, Çağatay Demiralp
Abstract: Rapidly creating effective visualizations using expressive grammars is challenging for users who have limited time and limited skills in statistics and data visualization. Even high-level, dedicated visualization tools often require users to manually select among data attributes, decide which transformations to apply, and specify mappings between visual encoding variables and raw or transformed attributes. In this paper we introduce Data2Vis, a neural translation model for automatically generating visualizations from given datasets. We formulate visualization generation as a sequence to sequence translation problem where data specifications are mapped to visualization specifications in a declarative language (Vega-Lite). To this end, we train a multilayered attention-based encoder-decoder network with long short-term memory (LSTM) units on a corpus of visualization specifications. Qualitative results show that our model learns the vocabulary and syntax for a valid visualization specification, appropriate transformations (count, bins, mean) and how to use common data selection patterns that occur within data visualizations. Data2Vis generates visualizations that are comparable to manually-created visualizations in a fraction of the time, with potential to learn more complex visualization strategies at scale.
12:45-2:20, Lunch
Daniela Oelke
Keynote: Humans and AI: From love-hate relationship to dream team?
Daniela Oelke, Siemens
Abstract: Artificial Intelligence (AI) is on the rise all around us. On the one hand, we love it, because it enables services and features that would not be possible without it. On the other hand, we fear it because of the lack of transparency that these systems often entail despite the huge impact they can have.
In my talk, I am going to give you an introduction to the field of Explainable Artificial Intelligence (XAI) which aims at providing transparency for AI systems. I will also share my experiences with employing Explainable AI in an industrial setting. Besides, I am going to exemplify the value of visualization for Explainable AI and highlight what role we as a visualization community can play in shaping the future of applied Artificial Intelligence.
In my talk, I am going to give you an introduction to the field of Explainable Artificial Intelligence (XAI) which aims at providing transparency for AI systems. I will also share my experiences with employing Explainable AI in an industrial setting. Besides, I am going to exemplify the value of visualization for Explainable AI and highlight what role we as a visualization community can play in shaping the future of applied Artificial Intelligence.
Bio: Daniela Oelke is Senior Key Expert for Explainable Artificial Intelligence and Visual Analytics at Siemens. She is passionate about helping others to discover what is possible with (visual) data analysis and how it can be used in data-driven innovation projects. At IEEE VIS she serves as a VisInPractice co-chair aiming at a higher visibility and attractiveness of IEEE VIS for practitioners and creating a space for practitioners and researchers to meet and share experiences, insights, and ideas in applying visualization and visual analytics to real-world use cases.
Prior to joining Siemens, Daniela Oelke was a research scientist at the DIPF (the German Institute for International Educational Research) in Frankfurt, Germany and the University of Konstanz, Germany. She received her Ph.D. in Computer Science from the University of Konstanz where her research focus was on Visual Document Analysis.
Session 3: Data Science in Domains
3:20-3:35, Session Chair: John Wenskovitch, Virginia Tech
3:20-3:35
Paper: Tackling Similarity Search for Soccer Match Analysis: Multimodal Distance Measure and Interactive Query Definition
Manuel Stein, Halldor Janetzko, Tobias Schreck, Daniel Keim
Abstract: Analysts and coaches in soccer sports need to investigate large sets of past matches of opposing teams in short time to prepare their teams for upcoming matches. Thus, they need appropriate methods and systems supporting them in searching for soccer moves for comparison and explanation. For the search of similar soccer moves, established distance and similarity measures typically only take spatio-temporal features like shape and speed of movement into account. However, movement in invasive team sports such as soccer, includes much more than just a sequence of spatial locations. We survey the current state-of-the-art in trajectory distance measures and subsequently propose an enhanced similarity measure integrating spatial, player, event as well as high level context such as pressure into the process of similarity search. We present a visual search system supporting analysts in interactively identifying similar contextual enhanced soccer moves in a dataset containing more than 60 soccer matches. Our approach is evaluated by several expert studies. The results of the evaluation reveal the large potential of enhanced similarity measures in the future.
3:35-3:50
Paper: Visual Analytics of Volunteered Geographic Information: Detection and Investigation of Urban Heat Islands
Daniel Seebacher, Matthias Miller, Tom Polk, Johannes Fuchs, Daniel Keim
Abstract: Urban heat islands are local areas where the temperature is much higher than in the vicinity and are a modern phenomenon that occurs mainly in highly developed areas, such as large cities. This effect has a negative impact on energy management in buildings and also has a direct impact on human health, especially for elderly people. With the advent of volunteered geographic information from private weather station networks, more high resolution data is now available within cities to better analyze this effect. However, such data sets are large and have heterogeneous characteristics requiring visual-interactive applications to support further analysis. We use machine learning methods to predict urban heat islands occurrences and utilize temporal and spatio-temporal visualizations to contextualize the emergence of urban heat islands to comprehend the influencing causes and their effects. Subsequently, we demonstrate the analysis capabilities of our application by presenting two use cases.
3:50-4:05
Paper: Uncertainty-Aware Visualization for Analyzing Heterogeneous Wildfire Detections
Annie Preston, Maksim Gomov, Kwan-Liu Ma
Abstract: There is growing interest in using data science techniques to characterize and predict natural disasters and extreme weather events. Such techniques merge noisy data gathered in the real world, from sources such as satellite detections, with algorithms that strongly depend on the noise, resolution, and uncertainty in these data. In this study, we present a visualization approach for interpolating multi-resolution, uncertain satellite detections of wildfires into intuitive visual representations. We use extrinsic, intrinsic, coincident, and adjacent uncertainty representations as appropriate for understanding the information at each stage. To demonstrate our approach, we use our framework to tune two different algorithms for characterizing satellite detections of wildfires.
4:05-4:20, Coffee Break
Session 4: Temporal Data
4:20-4:50, Session Chair: Leo Zhicheng Liu, Adobe Research
4:20-4:35
Paper: Guided Visual Exploration of Cyclical Patterns in Time-series
Davide Ceneda, Theresia Gschwandtner, Silvia Miksch, Christian Tominski
Abstract: The analysis of cyclical patterns in time-series data can be challenging. Interactive visualization techniques allow the analysts to identify recurring behavior by exploring the data. However, this kind of analysis usually requires time and considerable mental effort, because it relies completely on the user. Alternatively, automatic statistical methods can be employed to identify periodicities in the data. However, different methods could yield inconsistent results, and analysts still need to investigate the data visually. Guidance techniques have the potential to partially alleviate the burden on the user and leverage a more profitable analysis. In this paper, we describe the design and the implementation of a data-driven guidance technique to support the visual exploration of cyclical patterns in time-series. We use statistical results to support the visual analysis by providing guidance directly at the point of interacting with the visualization. In particular, we enrich a spiral plot with visual cues that suggest how the spiral must be configured to bring to light cyclical patterns. We evaluated our solution in a qualitative user-study, which showed that guidance can enhance the data exploration. The participants developed a deeper understanding of the data and had an increased confidence in the analysis outcome.
4:35-4:50
Paper: Progressive Sequential Pattern Mining: Steerable Visual Exploration of Patterns with PPMT
Vincent Raveneau, Julien Blanchard, Yannick Prié
Abstract: The progressive visual analytics (PVA) paradigm has been proposed to describe visual analytics systems whose main goal is to reach a thorough coupling between the analyst and her system by getting rid of waiting periods classically encountered during data processing. PVA systems use algorithms that both provide intermediate results throughout their execution, and are steerable by the analyst to change the strategy used to perform the remaining computation. Our focus is on progressive sequential pattern mining, as in the seminal work of Stolper et al.. Here we go further mainly by considering the temporal nature of patterns related to their occurrences. We propose a pattern-oriented data model, a pattern analysis task model, and guidelines for designing progressive pattern mining algorithms. We introduce PPMT, a tool to support analysts in their progressive exploration of activity traces, based on a modification of the GSP algorithm. We evaluate our proposal on the technical performances of our progressive algorithm, and on the effect of steering on analysts' performances.
4:50-5:50, PANEL: The Future of Visualization in Data Science.
Daniela Oelke, Kirk Goldsberry, Pat Hanrahan
Moderator: Hanspeter Pfister
Closing